The Revenue Leak Map: Where Leads Disappear Between Teams
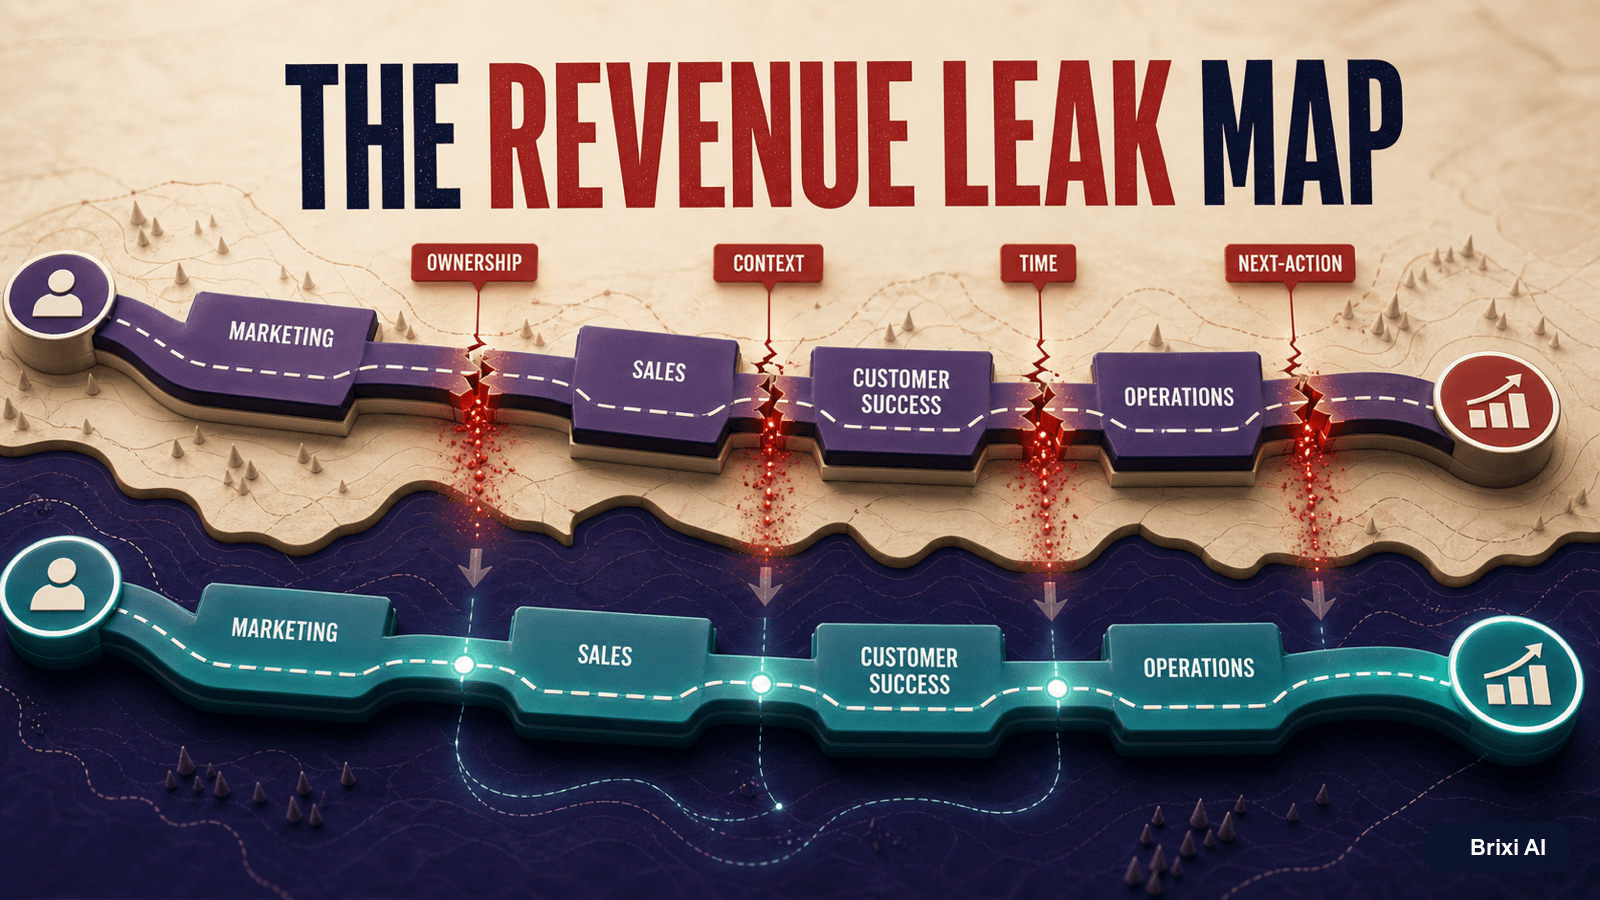
Most lead leakage is not inside a team. It happens between teams, channels, and workflow states. A Revenue Leak Map makes those invisible gaps measurable.
At Friday pipeline review, marketing reports 2,400 leads, sales reports 1,860 assigned records, and the contact center reports 1,510 attempted conversations. No one can explain the missing 890 outcomes. Every team met its activity target. Revenue still leaked.
The missing leads did not vanish in one dramatic failure. They slipped through handoffs: a duplicate was ignored, a callback lacked an owner, a WhatsApp reply stayed in a shared inbox, and a qualified inquiry entered the wrong queue. The Revenue Leak Map is designed to find those gaps.
Revenue leakage is usually a state-transition problem
Teams inspect stages as static totals. Leakage occurs during movement from one state to another: captured to identified, identified to assigned, assigned to contacted, contacted to qualified, qualified to scheduled, and scheduled to attended.
A Revenue Leak Map measures every transition by volume, elapsed time, owner, required context, and failure reason. It replaces broad blame with a specific operating diagnosis.
Four things disappear at broken handoffs
A lead can retain its record and still lose what matters. The owner may be unclear. The conversation context may not travel. The response window may expire. The next action may be missing or impossible to complete.
These losses often compound. A delayed assignment produces a cold call. The cold call produces a vague note. The next rep lacks context and sends a generic message. The buyer disengages, and the CRM records no clear reason.
- Ownership: who is accountable now?
- Context: what does the next person need?
- Clock: when does the opportunity decay?
- Action: what specific completion is expected?
Activity metrics hide transition failure
Calls made, messages sent, and tasks completed show effort. They do not prove that leads reached the next meaningful state. A team can increase activity while the attended-meeting rate falls.
Measure transition outcomes instead: contact established, qualification completed, appointment confirmed, issue resolved, payment committed. Then connect failure reasons to the exact transition where they occurred.
The map should include customer-created detours
Real journeys are not linear. Buyers ask to change channels, call from a different number, reschedule twice, introduce another person, pause for budget, or return after weeks of silence.
A map that models only the happy path will classify normal customer behavior as exceptions. The operating system needs recovery paths that preserve identity, history, ownership, and intent.
- Reschedule and no-show recovery
- Channel switching with shared context
- Reactivation after inactivity
- Escalation for urgency, value, or dissatisfaction
Inspect transitions, not departments
The most expensive revenue leaks live where one team believes its work ended and the next team does not know its work began.
Brixi makes handoffs observable and executable
Brixi connects acquisition conversations, CRM records, AI qualification, routing, workflow actions, and human follow-up. Each transition can carry the owner, context, clock, and required completion together.
Managers can inspect not only where a lead sits, but how it arrived, what the customer expressed, which action is overdue, and why a workflow failed. Recovery can start from evidence rather than another export.
- Shared customer identity across entry points
- Transition-based ownership and SLA rules
- Conversation context attached to every handoff
- Failure reasons and recovery actions in one audit trail
After one quarter, the map should change operating reviews
Begin with six to eight transitions that directly affect revenue. Establish baseline volume, success rate, median time, and failure reasons before redesigning the workflow.
After a quarter, reviews should focus on the largest transition gaps and the recovery actions with the strongest yield. Teams stop debating whose dashboard is correct because the customer journey becomes the shared unit of analysis.
- Reconciled counts across acquisition and sales
- Faster assignment and first meaningful response
- Higher qualification-to-appointment conversion
- Visible reasons for stalled and recovered journeys
The deeper bet is that handoffs become products
A reliable handoff needs design, instrumentation, ownership, and continuous improvement. Treating it as a message between departments guarantees inconsistency.
AI-native customer platforms turn handoffs into programmable products. They move context and accountability together, recover predictable detours, and show leaders where execution still breaks.
Find the leaks hidden between your teams
Use Brixi to connect acquisition, qualification, routing, follow-up, and customer outcomes in one observable journey.
Book a revenue workflow reviewFrequently Asked Questions
It is a transition-level view of the customer journey showing volume, ownership, context, elapsed time, expected action, outcome, and failure reason.
Track transition volume, success rate, median and tail latency, owner acceptance, completion rate, failure reason, recovery rate, and downstream conversion.
Start with the transitions between lead capture, assignment, first response, qualification, appointment, and attendance because they usually carry visible revenue impact.